Blip, a simple uptime monitor
The quest for a simple, self-hosted uptime and performance monitor
Over the years, I’ve employed a variety of tools to check my websites’ uptime and performance. For a while, I used StatusCake – but that was a paid service, and I felt the cost did not justify the value I was getting from it.
More recently, I’ve been using the tools supplied by DigitalOcean. A number of my sites are hosted on DigitalOcean, so it seemed to make sense.
But over the past few weeks I’ve started using a Raspberry Pi as a local server for hosting my music library (through Navidrome) and my audiobooks (using Audiobookshelf). This was prompted by a post by Jon Hicks on his search for the perfect digital music app.
The success of this got me to thinking: “What else can I run on this server? It seems to have spare capacity…” – and so I decided to run my own uptime monitoring service for all my websites.
Having had a good experience with Navidrome and Audiobookshelf, I looked for another existing solution I could just drop in as a docker container. I had a few simple requirements:
- Free and open source
- Runnable via Docker
- Lightweight
- Able to check both uptime and performance (response time), and alert accordingly
Existing solutions
There were a few candidates. I first tried Uptime Kuma, which was really simple, but only checked to see if the site was up or down, so failed on the performance requirement.
Another option was Gatus, which was more fully featured, allowing for multiple conditions to be considered when checking a site’s status – but at the end of the day, these checks still resulted in a binary outcome (pass or fail), although it would tell you why a check failed.
I wanted a 3-state solution: up, down or degraded. This would provide visibility (and tailored alerts) when the site was up but responding slowly, or down altogether – and when the site had recovered from this status. And so – again inspired by Jon’s article – I decided to build by own monitoring service, with the help of Claude Code.
Building with Claude
I’ve been using Claude Code recently for my work projects, and it’s been a great help. But this is the first time (aside from creating a small bash script) that I’ve used it to build a tool because the one I wanted does not exist.
I started small, with few requirements. This was my initial prompt:
I would like a simple service to run on my Pi that will do uptime monitoring of external sites (hosted on Digital Ocean droplets).

I need availability monitoring of websites, but also warnings of slow responses over a certain response time, e.g.:

- healthy
- running but slow
- site is down

It should be installable as a Docker image, and with a web front end
…and I was astounded how polished even the initial offering was. Within a few further iterations, I had a service that I was ready to deploy and start monitoring sites. I added a notification system, which will allow for multiple notification channels, although the only one so far is email over SMTP. And I got it to add the ability to view different periods of the data, combining checks into buckets when looking at a longer time period, and drilling down or selecting specific time ranges.
There is no in-app configuration yet – all checks and notifiers are defined in a sites.yaml file, but that can be added later. And there is no security yet – everything is public (if you expose it to the internet), but the front end is completely read-only, so if the stats are not sensitive, that’s not a problem.
The app is written in Python – Claude’s choice, which I went with even though I know very little of the language. But it might be an interesting way to pick up a little of it!
Oh, and I also got Claude to suggest a shortlist of names for the app; I settled on Blip, which I feel reflects both what the app does, and its lightweight nature. Of the three logo treatments I asked for, this was my winner:

Closing the AI loop
Taking further inspiration, this time from a project from Remy Sharp, I decided to add an MCP server to the app. A couple of instructions to Claude later, and the app that has been built with AI can also be queried by AI, which I think can provide some valuable insights into the uptime data.
This is something not provided by any of the existing solutions I looked at – and, to be honest, not something I’d even considered. But I think there will be great power in being able to ask questions like these:
- give me an overview of my sites’ uptime over the past 24 hours
- has anything been flaky this week?
- what happened to the client site overnight and how long was it down?
Ready for release!
I now have an working app which is beyond what I’d initially envisioned, and which I am happy to release into the wild – and so Blip v1.0.0 has now been released!
Here are a couple of screenshots of Blip in action:
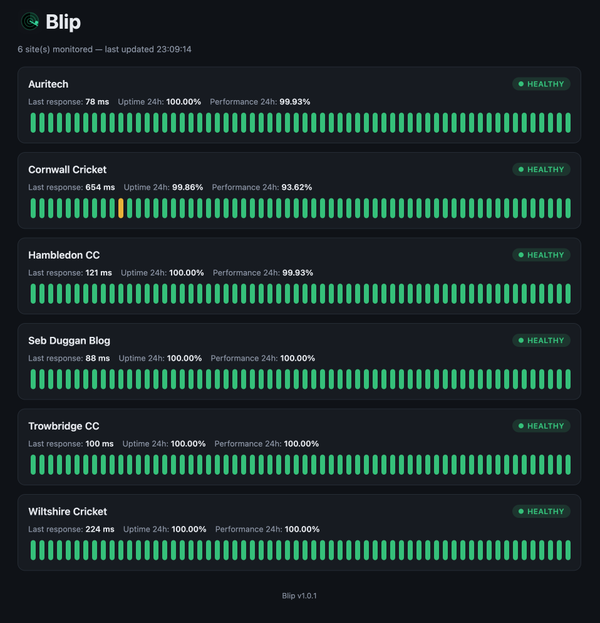
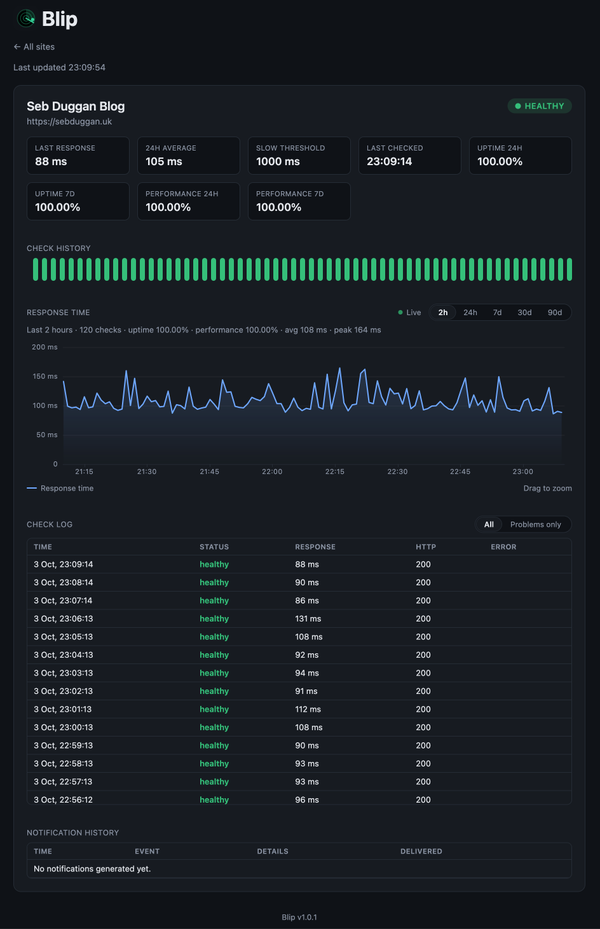
You can find Blip on Gitlab – please take a look, kick the tyres and take it for a spin. And if you have any comments or feedback – good or bad! – please let me know. It would be great to know that Blip is useful for other users, but at the end of the day I now have the tool I wanted, and with the ability to add more features as and when I need them.